October 17, 2025
Why the experience of retirement savings doesn’t always match the data
Key insights:
Why your 401(k) returns don’t match the headlines: Most savers never experience the full market return because their contributions are spread out over time. Money added later has less time to grow, so personal results lag behind the fund’s performance charts.
Three returns, three different stories: Time weighted return shows how the fund performed. Money weighted return shows what your actual dollars earned. Return on equity shows how much your total savings grew compared to what you invested. All are true, just measuring different things.
Time in the market matters more than timing: Getting more money invested earlier lets your savings compound longer, making your personal return look much closer to the market’s headline numbers.
Why Your 401(k) Returns Don’t Match Market Performance
The returns you see on a 401(k) fund’s fact sheet tell one story, while the returns you actually experience tell another, and understanding that gap is key to smarter retirement investing. This is the Vanguard Target Retirement 2040 Fund, symbol VFORX. For those 15 years away from retirement (at age 65) this may be their plan’s Qualified Default Investment Alternative (QDIA). If you look this fund up on Morningstar you will see this, which shows the growth of 10,000 over the past 10 years.
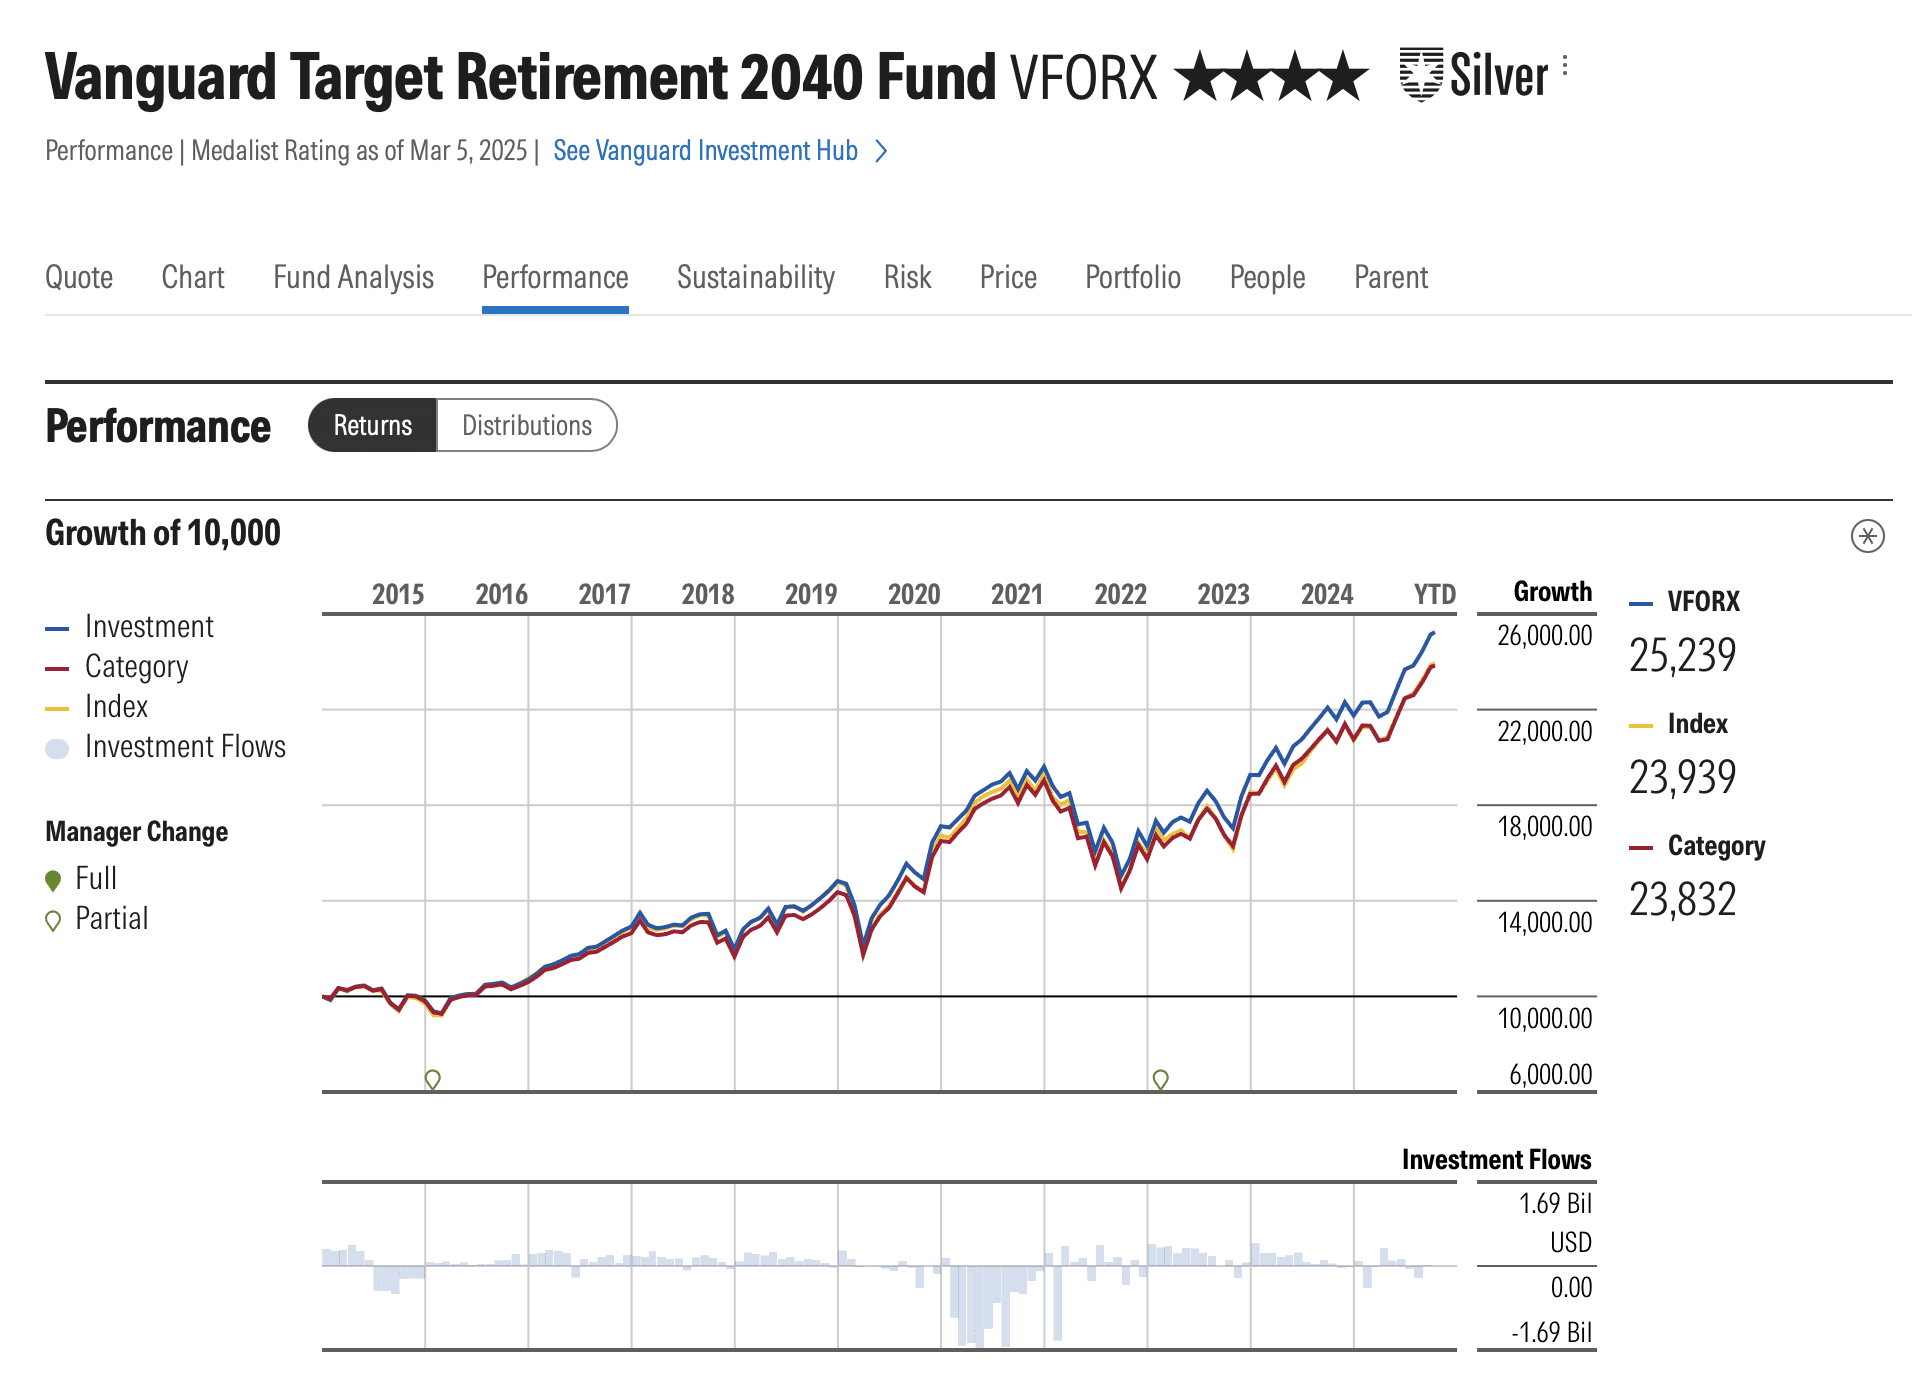
Source: Morningstar
The fund has a four-star rating, and its total return has annualized at over 10%. This is a solid low-cost option for anyone who wants to put their retirement savings and investment allocation on auto-pilot. The problem is most retirement savers will not experience the annualized 10% nor will they see their retirement balance grow 50% over five years.
Why not? It’s the math of making regular contributions versus a one-time investment. There are lots of ways to evaluate investment performance and trailing returns provides the best assessment how an investment has done, but it doesn’t reflect the reality of contributing more money over time.
Why “Total Return” Doesn’t Tell the Whole Story
When you look up an investment online, the number you usually see is the time weighted return. This is the return of the investment itself, as if you had put all your money in at the beginning of the period and never added or withdrew a cent.
It strips away the effect of cash flows so it shows how the fund performed, not how any actual investor likely experienced it. That’s why the chart that starts with $10,000 growing to $25,000 over 10 years looks so good. It’s a simple story of compounding over time, but it’s not most people’s story.
A money weighted return tells a different story. It captures the return of your actual dollars, including the timing of when you contributed them. Each contribution grows for a different amount of time, so the dollars you put in early have more time to compound, and the dollars you add later benefit less from past gains.
This is why the experience of someone steadily contributing to a 401(k) almost never matches the headline performance figure. If you were putting in $1,000 every two weeks for five years, most of your money arrived late in the period and didn’t get to ride the full 60 percent cumulative return. The money weighted return is what you actually lived through.
Then there’s return on equity, which focuses on the growth of the account relative to the total amount you’ve contributed. It tells you how much value was created on top of what you put in. If you started with $10,000 five years ago and made $1,000 bi-weekly contributions you have contributed $140,000 and now have $190,000, your return on equity is just 36 percent.
It’s a simple way to answer the question, “How much did my savings grow compared to what I invested?” Unlike time weighted returns, which look backward at market performance, or money weighted returns, which look at the timing of contributions, return on equity gives you a snapshot of what you’ve earned in total.
These three numbers are all true at the same time. They’re just measuring different things. The time weighted return tells the story of the fund. The money weighted return tells the story of your behavior. The return on equity tells the story of your actual balance. That’s why retirement investing can feel different from the charts.
Our View
The hardest part of retirement investing is staying patient when the numbers don’t seem to match the market narrative. That gap isn’t about making bad decisions. It’s a natural outcome of how regular contributions interact with market returns. Most dollars arrive over time, not at the start, and so they don’t participate equally in compounding.
Financing can be one way to close that gap by front-loading the amount of capital at work. In the earlier example, starting with $50,000 instead of $10,000 would have allowed a much larger share of the total savings to compound over the full five-year period. The result would have tracked much more closely with the fund’s published performance.
The simple fact is that time in the market matters as much as the return itself. The earlier the money is invested, the more it can benefit from compounding, and the closer an investor’s experience will come to matching the story told by performance charts.